|
1 2 3 4 5 6 7 8 9 10 11 12 13 14 15 16 17 18 19 20 21 22 23 24 25 26 27 28 29 30 31 |
library(zoo) library(ggplot2) getshiller <- function(source="http://www.econ.yale.edu/~shiller/data/ie_data.xls",cachefile="shiller.RData") { library(gdata) if (file.exists(cachefile)) { load(cachefile) return(x) } xraw <- read.xls(source, sheet = 1, verbose=FALSE, perl="perl") xraw[xraw=="#N/A"] <- NA rawrows <- dim(xraw)[1] rawcols <- 11 t.x <- as.Date(sprintf("%4.2f.01",as.numeric(as.vector(xraw[,1]))),"%Y.%m.%d") ok <- !is.na(t.x) x <- zoo(as.numeric(as.vector(xraw[ok,2])),t.x[ok]) for ( i in seq(3,rawcols) ) { z <- zoo(as.numeric(as.vector(xraw[ok,i])),t.x[ok]) x <- merge.zoo(x,z) } colnames(x) <- c("P","D","E","CPI","DateFraction","LongRate","P.real","D.real","E.real","CAPE") save(x,file=cachefile) return(x) } shiller <- getshiller() ggplot(fortify(shiller[,c("P.real","CAPE","LongRate")],melt=TRUE)) + geom_line(aes(x=Index,y=Value,colour=Series)) + facet_grid(Series ~ .,scales = "free_y") + theme_bw() + theme(legend.position="none",axis.title.x=element_blank(),axis.title.y=element_blank()) |
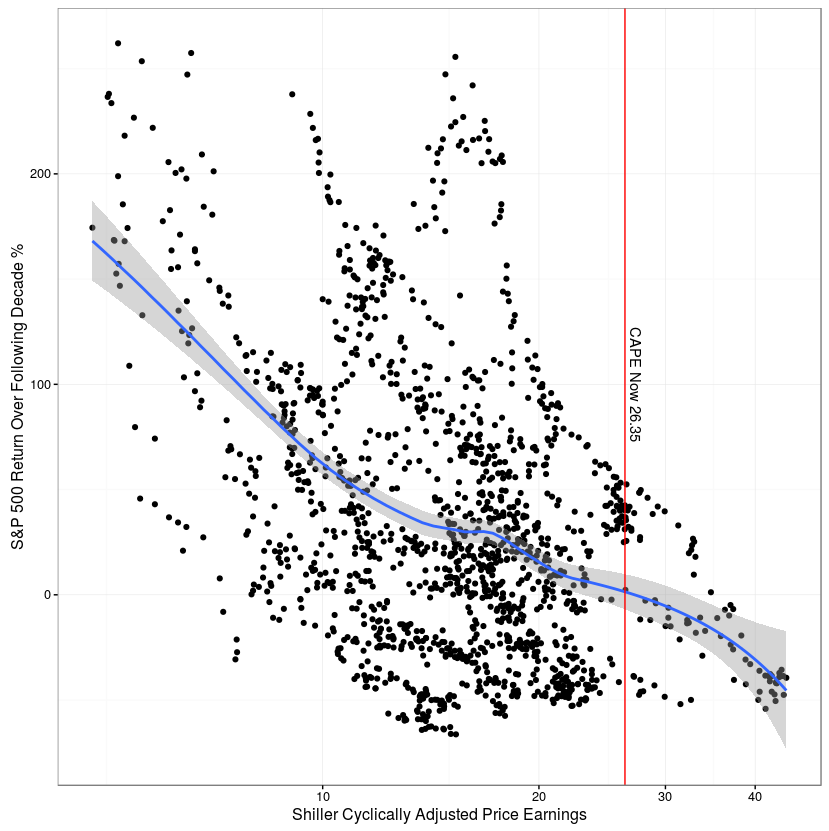
We can also plot the decade ahead S&P 500 return vs cyclically adjusted price earnings today to see if Shiller’s CAPE provides a lead indicator of future returns.
|
1 2 3 4 5 6 7 8 9 10 11 12 13 14 15 16 17 18 19 20 21 |
# calculate 10 year S&P 500 return spx <- shiller$P.real spx.rtn.10y <- 100*(lag(spx,120) / spx - 1) # merge 10 year ahead S&P 500 return with CAPE today decade.ahead.return.cape <- merge(spx.rtn.10y,shiller$CAPE) decade.ahead.return.cape <- decade.ahead.return.cape[!is.na(apply(decade.ahead.return.cape,1,sum)),] df <- data.frame(decade.ahead.return.cape) n <- nrow(df) cape.now <-as.numeric(shiller$CAPE[nrow(shiller)]) ggplot(df,aes(x=shiller.CAPE,y=spx.rtn.10y)) + geom_point() + geom_smooth(method = "loess", formula = y ~ x, size = 1) + coord_trans(x="log2") + theme_bw() + geom_vline(xintercept = as.numeric(shiller$CAPE[nrow(shiller)]),colour="red") + annotate(geom = "text",x = cape.now,y=100,label=paste("CAPE Now",cape.now),angle=-90,vjust=-0.5) + xlab("Shiller Cyclically Adjusted Price Earnings") + ylab("S&P 500 Return Over Following Decade %") + theme(legend.position="none") |
This shows Shiller’s CAPE on the x-axis and S&P 500 return over the following decade on the y axis. The vertical red line is the most current value of Shiller CAPE.