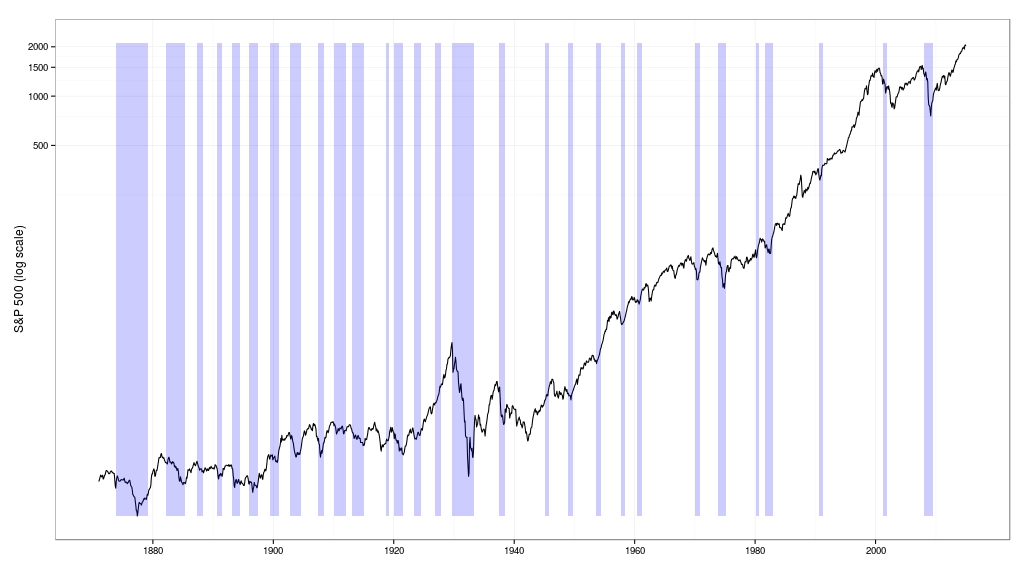
As an example we can plot the S&P 500 using the getshiller() function that we have described here.
|
1 2 3 4 5 6 7 8 9 10 11 |
shiller <- getshiller() z <- log(shiller$P) z <- shiller$P g <- ggplot(fortify(z,melt=TRUE)) + geom_line(aes(x=Index,y=Value)) + ylab("S&P 500 (log scale)") + coord_trans(y="log10") + theme_bw() + theme(axis.title.x = element_blank()) g |
This function gets the NBER recession data from your local cache of FRED data (see here for the function definition) and builds a data frame with the recession start and end dates. Then it adds a geom_rect() in blue with transparency (alpha=0.2) so you can see any lines or text through the shading.
|
1 2 3 4 5 6 7 8 9 10 11 12 13 14 15 16 17 18 19 |
recession.shade <- function(g,z) { fred <- get_fred() recession <- nm(fred$USRECD) drecession <- diff(recession) recession.start <- time(drecession[drecession==1]) recession.end <- time(drecession[drecession==-1]) recession.df <- data.frame(recession.start ,recession.end[2:length(recession.end)]) colnames(recession.df) <- c("start","end") g <- g + geom_rect(data=recession.df[recession.df$start >= start(z),] , aes(xmin=start , xmax=end , ymin=min(z,na.rm=TRUE) , ymax=max(z,na.rm=TRUE)) , fill='blue' , alpha=0.2) return(g) } |
Using this function it is straightforward to add recession shading to a univariate zoo time series by passing in the zoo time series plot and the ggplot plot object like this:
|
1 |
recession.shade(g,z) |
The end result looks like this: