library(zoo)
library(ggplot2)
getshiller <- function(source="http://www.econ.yale.edu/~shiller/data/ie_data.xls",cachefile="shiller.RData") {
library(gdata)
if (file.exists(cachefile)) {
load(cachefile)
return(x)
}
xraw <- read.xls(source, sheet = 1, verbose=FALSE, perl="perl")
xraw[xraw=="#N/A"] <- NA
rawrows <- dim(xraw)[1]
rawcols <- 11
t.x <- as.Date(sprintf("%4.2f.01",as.numeric(as.vector(xraw[,1]))),"%Y.%m.%d")
ok <- !is.na(t.x)
x <- zoo(as.numeric(as.vector(xraw[ok,2])),t.x[ok])
for ( i in seq(3,rawcols) ) {
z <- zoo(as.numeric(as.vector(xraw[ok,i])),t.x[ok])
x <- merge.zoo(x,z)
}
colnames(x) <- c("P","D","E","CPI","DateFraction","LongRate","P.real","D.real","E.real","CAPE")
save(x,file=cachefile)
return(x)
}
shiller <- getshiller()
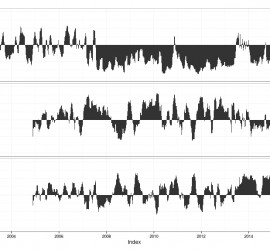
ggplot(fortify(shiller[,c("P.real","CAPE","LongRate")],melt=TRUE)) +
geom_line(aes(x=Index,y=Value,colour=Series)) +
facet_grid(Series ~ .,scales = "free_y") +
theme_bw() +
theme(legend.position="none",axis.title.x=element_blank(),axis.title.y=element_blank())